• Skip to primary navigation
  • Skip to main content
  • Skip to primary sidebar
  • Skip to footer

The Alexandria Archive Institute

OPENING THE PAST, INSPIRING THE FUTURE

  • About
    • History
    • Mission
    • People
    • Governance
    • Community
    • What We Do
      • Open Context
      • Technology Innovation
      • Research
        • Projects
          • Data Literacy Program
          • Digital Data Stories
          • Digging Up Data
          • Sustainability, Collaboration, & Network Building
          • Digging Digital Museum Collections
            • Resources
      • Advocacy & Leadership
      • Education & Training
    • Impacts
      • Publications
  • News
  • Data Stories
    • Data Literacy Program
      • Archaeological Data Literacy Practicum
  • NEH-NADAC
    • NADAC People
      • NADAC Faculty
      • NADAC Advisors
      • NADAC Scholars
      • NADAC Core Team
    • NADAC Resources
      • NADAC Curriculum
    • NADAC Apply
  • Digging Up Data
    • Application Information (2026)
    • Workshop Series
  • FAIR+CARE
  • Search
  • Donate Now!

Open Educational Resources

Text on a white background with two rhombuses, the one on the left in dark blue and the one on the right in light blue next to one another to make a book like image. The First line text reads Open Context, the next reads a service of the Alexandria Archive institute the next, those are both in black letters, the title beneath that reads Archaeological Data Literacy and Comics in light blue matching the light blue in the book image, the words below that are "Bringing a passion project to a postdoctoral position" also in light blue. Beneath that in black it reads "Paulina F. Przystupa (@punuckish)" and then on a new line "ciszka@opencontext.org | ciszka@unm.edu" which are hyperlinked. And then on a new line "2 March 2023 - 8am PST". and then on a new line "California State University - Chico".

Archaeological Data Literacy and Comics

March 9, 2023 by Paulina Przystupa

Paulina F. Przystupa, a member of The Alexandria Archive Institute (AAI) team recently talked about the overlap between archaeological data literacy and comic books. Specifically, the talk focused on how Paulina brought a love of comics to the Data Literacy Program (DLP). 

On the right is blue text on a white background listing: The Tutorial Series; The Creative Series; The Dialogues Series; The Aggregative Series (which is in a light blue rounded box); The Solo Series; The Interactive Series; The Publication Series with each series on its own row; to the left is a grey box with text primarily in black. The text reads “Reading data involves understanding what data is, and what aspects of the world it represents. Working with data involves acquiring, cleaning, and managing it. Analyzing data involves filtering, sorting, aggregating, comparing, and performing other such analytic operations on it. Arguing with data involves using data to support a larger narrative intended to communicate a message to a particular audience. Bhargava, Rahul, et al. “Data murals: Using the arts to build data literacy.” The Journal of Community Informatics 12.3 (2016). Throughout this document, data stories are aligned to show how they can be used to reinforce Reading, Working, Analyzing, and Arguing with data.” Reading is in dark blue matching a circular book spine icon to the left of the text that is in white lines on the blue background; Working is in light blue matching a tabbed planner-style circular icon in white lines on the same light blue; Analyzing is in lavender corresponding to a circular computer icon in white lines on the same lavender; and Arguing is in pink corresponding to a circular text books icon in white lines

Listicles and Literacy – The Aggregative Series to promote data literacy

March 2, 2023 by Paulina Przystupa

For this Digital Data Stories (DDS) Series on Series entry, we’re introducing our Aggregative Series. While you may have misread that as our aggressive series, this series aggregates existing resources that teach archaeological data literacy. Currently, these will act as both recommendations for existing work from our staff  and a Data Story, guiding groups through […]
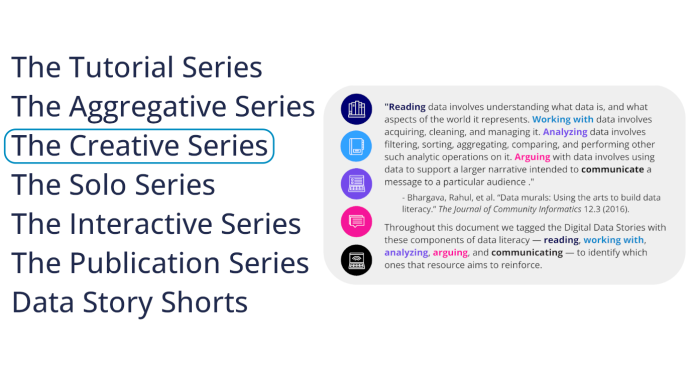
On the right is blue text on a white background listing: The Tutorial Series; The Aggregative Series; The Creative Series (which is in a light blue rounded box indicating the focus of this article); The Solo Series; The Interactive Series; The Publication Series; and Data Story Shorts with each series on its own row. To the left is a grey box with text primarily in black. The text reads “Reading data involves understanding what data is, and what aspects of the world it represents. Working with data involves acquiring, cleaning, and managing it. Analyzing data involves filtering, sorting, aggregating, comparing, and performing other such analytic operations on it. Arguing with data involves using data to support a larger narrative intended to communicate a message to a particular audience. Bhargava, Rahul, et al. “Data murals: Using the arts to build data literacy.” The Journal of Community Informatics 12.3 (2016). Throughout this document, data stories are aligned to show how they can be used to reinforce Reading, Working, Analyzing, and Arguing with data.” Reading is in dark blue matching a circular book spine icon to the left of the text that is in white lines on the blue background; Working is in light blue matching a tabbed planner-style circular icon in white lines on the same light blue; Analyzing is in lavender corresponding to a circular computer icon in white lines on the same lavender; and Arguing is in pink corresponding to a circular text books icon in white lines.

Keep it Creative: The Creative Series and data literacy

February 2, 2023 by Paulina Przystupa

For this Digital Data Stories (DDS) Series on Series entry, we (the Data Literacy Program) are introducing our Creative Series. One might assume that creativity rarely enters discussions of archaeological data literacy. However, the complex skills required to create art and story are perfect for the palimpsest that is archaeology. Knowing this, we thought it […]

Table of Contents in large purple letters is in the upper left, the next line down reads How to Use this in blue with the number 3 next to in indicating the page to find that information; Document Project Aims, Definitions, and Terms is on the next line down also in a dark blue with the number 4 next to it for that page; the next line has The Tutorial Series in dark blue with the number 5 next new it; the next line has Cow-culating Your Data with Spreadsheets and R in light blue with 6 next to it; the next line has Gabbing about Gabii: Going from Notes to Data to Narrative in light blue on the next line with the nubmerf 7 by it; the next line has The Creative Series in dark blue in larger letters again with 8 by it; with the last line reading It’s All in the Wrist (Bones): Archaeological Data as Artistic Inspiration in light blue with the number 9 by it

The Fall 2022 Data Stories Table of Contents!

September 27, 2022 by Paulina Przystupa

We’re happy to announce the Data Literacy Program’s (DLP’s) first Table of Contents (TOC). The TOC is a preview of our existing and future Data Stories. And we designed this handy resource to outline data stories you can incorporate in classes now or in the future.

Text on a white background with two rhombuses, the one on the left in dark blue and the one on the right in light blue next to one another to make a book like image. The First line text reads Open Context, the next reads a service of the Alexandria Archive institute the next, those are both in black letters, the title beneath htat reads Data Literacy and Data visualization in light blue matching the light blue in the book image, the words below that are Paulina F. Przystupa, MA (@punuckish) ciszka@opencontext.org 9 August 2022 9am-12pm

Winning them over to the data side – An ARF workshop on Data lit and viz

September 8, 2022 by Paulina Przystupa

Paulina guest lectured for the students of the Archaeological Research Facility (ARF) Peralta Hacienda Historical Park field school about Data Literacy (Data Lit) and Data Visualization (Data Viz).

Data Stories Logo

The Digital Data Stories Series

August 8, 2022 by Paulina Przystupa

To help us organize our Data Stories the Data Literacy Program (DLP), we decided to organize the stories into seven series. We’ve mentioned this a few times and we thought it would be good to explain a bit more about what these series are and why we chose to do this. 

  • Page 1
  • Interim pages omitted …
  • Page 6
  • Page 7
  • Page 8
  • Page 9
  • Page 10

Primary Sidebar

  • About
    • History
    • Mission
    • People
    • Governance
    • Community
    • What We Do
      • Open Context
      • Technology Innovation
      • Research
        • Projects
          • Data Literacy Program
          • Digital Data Stories
          • Digging Up Data
          • Sustainability, Collaboration, & Network Building
          • Digging Digital Museum Collections
            • Resources
      • Advocacy & Leadership
      • Education & Training
    • Impacts
      • Publications
  • News
  • Data Stories
    • Data Literacy Program
      • Archaeological Data Literacy Practicum
  • NEH-NADAC
    • NADAC People
      • NADAC Faculty
      • NADAC Advisors
      • NADAC Scholars
      • NADAC Core Team
    • NADAC Resources
      • NADAC Curriculum
    • NADAC Apply
  • Digging Up Data
    • Application Information (2026)
    • Workshop Series
  • FAIR+CARE
  • Search

Footer

Contact

contact@alexandriaarchive.org
125 El Verano Way
San Francisco, CA 94127
415-425-7380

Visit

Support AAI

Donate